October 01, 2017
By Florida Sportsman Editor
Most populations are above long-term averages
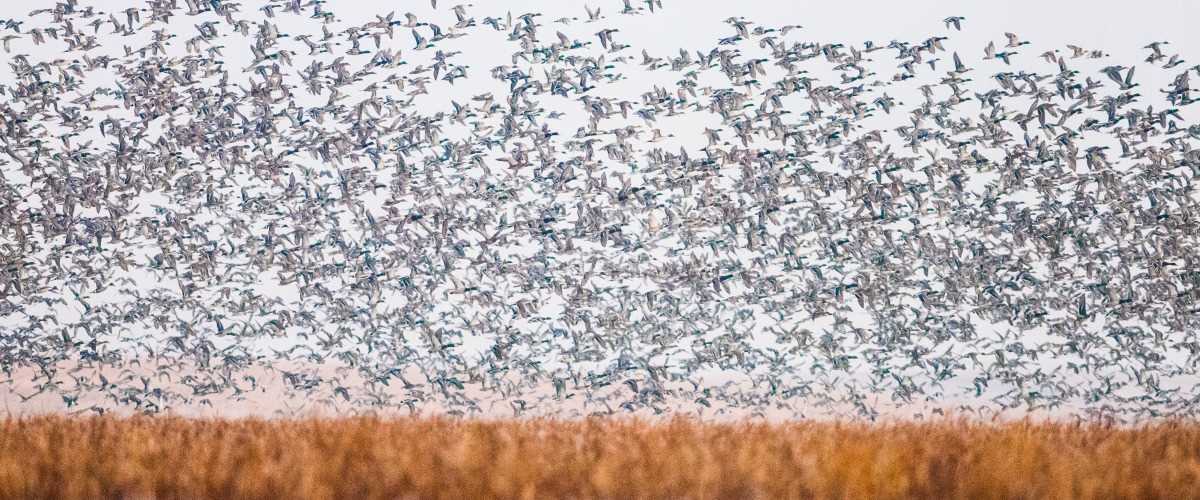
 Photo credit: Ducks Unlimited
The U.S. Fish and Wildlife Service (FWS) released its report on 2017 Trends in Duck Breeding Populations, based on surveys conducted in May and early June by FWS and the Canadian Wildlife Service. Overall duck numbers in the survey area remain high. Total populations were estimated at 47.3 million breeding ducks in the traditional survey area, which is similar to last year's estimate of 48.4 million and is 34 percent above the 1955-2016 long-term average. The projected mallard fall flight index is 12.9 million birds, similar to the 2016 estimate of 13.5 million.
The main determining factor for duck breeding success is wetland and upland habitat conditions in the key breeding landscapes of the prairies and the boreal forest. Conditions observed across the U.S. and Canadian survey areas during the 2017 breeding population survey were generally similar to last year with a few exceptions. The total pond estimate for the United States and Canada combined was 6.1 million, which is 22% above the 2016 estimate of 5.0 million and 17% above the long-term average of 5.2 million.
“The surveys indicate that wetland conditions and populations of most frequently harvested ducks remain above the long-term average, and for most species, populations were at or above those from last year,” said DU Chief Scientist Tom Moorman. “This is great news for waterfowlers who can now turn their attention to preparing habitat, tuning up dogs and relentlessly watching the weather forecasts for the onset of fall and winter weather that will push the birds on their annual southward migration.
“DU remains concerned about northern pintails and scaup in particular, as the survey information continues to indicate these two species remain below their long-term average populations. Both species have struggled to regain desired populations. We will continue to work with our many conservation partners to understand what drives populations of these two species. If science points to habitat limitations as contributing factors, we'll rely on the science to develop conservation solutions to help restore populations of these birds.
“Hunters may notice in the report that mallards declined 11%, or about 1.3 million birds, from 2016. The bulk of that appears to be related to drier conditions in the Canadian parklands region, where the surveys detected about 0.6 million fewer mallards. Overall, mallard populations remain in great shape, and FWS estimates the mallard fall flight will be similar to last year.
“Hunters should always remember that habitat and populations are going to vary over time, so we must keep focused on habitat conservation efforts over the long term. Ultimately, we need to maintain landscapes so that when precipitation and other conditions are right, the ducks will respond, produce more ducks and provide us all with a nice return on our conservation investments.”
Although most migratory game bird populations remain abundant, when and where birds will be encountered depends on many factors. Food availability, habitat and weather conditions, and other factors all influence local bird abundance, distribution, behavior and, ultimately, hunter success.
The spring surveys provide the scientific basis for many management programs across the continent, including hunting regulations. Individual states set their hunting seasons within a federal framework of season length, bag limits and dates. Hunters should check the rules in their states for final dates and bag limits.
Species estimates are:
Mallards: 10.5 million, 11% lower than 2016 and 34% above LTA
Gadwall: 4.2 million, 13% above 2016 and 111% above LTA
American wigeon: 2.8 million, 19% below 2016 and 6% above LTA
Green-winged teal: 3.6 million, 16% below 2016 and 70% above LTA
Blue-winged teal: 7.9 million, 18% above 2016 and 57% above LTA
Northern shovelers: 4.4 million, 10% above 2016 and 69% above LTA
Northern pintails: 2.9 million, 10% above 2016 and 27% below LTA
Redheads: 1.1 million, 13% below 2016 and 55% above LTA
Canvasbacks: 0.7 million, similar to 2016 and 25% above LTA
Scaup: 4.4 million, 12% below 2016 and 13% below LTA
Black ducks (Eastern Survey Area): 0.5 million, similar to 2016 and 12% below LTA
*Long-term average
View all the data and get a species-by-species breakdown at www.ducks.org/DuckNumbers.

